NPV Confidence Level Values
Confidence level values provide an approach to reporting NPV risk model results in a way that has direct meaning to decision makers. They can be expressed relative to targets e.g.
- There is a 71% level of confidence that the project NPV will exceed £2m.
- There is a 94% level of confidence that the project NPV will be positive i.e. greater than zero.
NPV forecasts can also be associated with confidence levels that are set by the organisation e.g.
- The NPV forecast at the P90 (90%) confidence level is £0.31m.
- The NPV forecast at the P50 (50%) confidence level is £3.84m.
Note that NPV forecasts fall as increasing levels of confidence are required.
Reading Confidence Levels from Cumulative Probability S-curves
Confidence levels can be read directly from cumulative probability S-curves. However, care needs to be taken to avoid an easy mistake. The risk model results (taken from the simple example NPV Risk Model) below can be used by way of example.
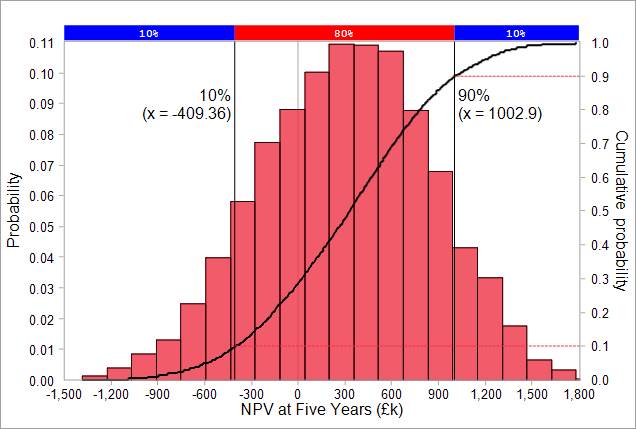
The 10th percentile forecast shown by the above S-curve is -£409k. Since 90 per cent of the NPV values are higher, there is a 90% level of confidence that project's NPV will be that value or higher. This is the point that represents the P90 confidence value.
The easy mistake would be to read the P90 level of confidence as being the value of £1,002.9k displayed next to the 90% figure in the graph. However, this is the 90th percentile in the cumulative probability curve, beyond which only 10 per cent of simulated values lie, and is thus the P10 confidence level; an optimistic forecast which companies upon which most organisations would not base their decisions on.
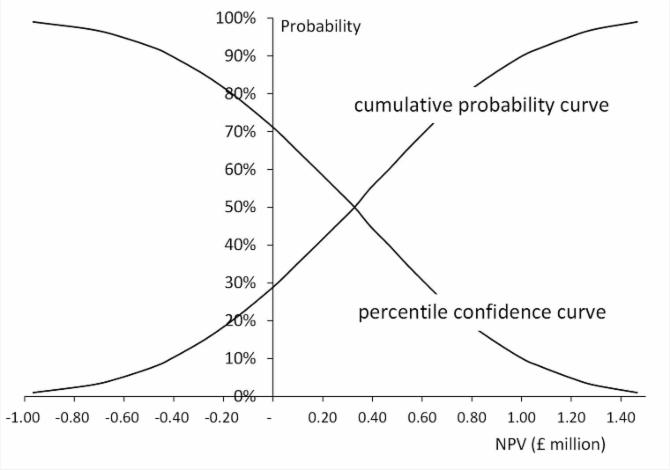
The use of downwards sloping S-curves for NPV risk model forecasts
Given the potential for confusion between confidence level values and percentiles in cumulative probability S-curves, some organisations prefer to plot NPV forecasts using confidence levels for the y-axis rather than cumulative probability. This produces downwards sloping S-curves that are the mirror image (drawn horizontally through the 50% point in the y-axis) of their cumulative probability equivalents. The figure below shows the two S-curves that can be produced from the results shown above.