Risk Prioritisation Results
Risk prioritisation is usually considered to be an important product of risk analysis. An advantage of NPV risk modelling is that it enables risks to be prioritised in the context of the overall risk model. Two techniques which enable risk prioritisation results to be reported using tornado charts are described below .
Cruciality
During the Monte Carlo simulation process, a model's output varies in response to variations amongst its inputs. Simulation tools are able to calculate by regression the correlation between values simulated for each input and the model's output. These correlation results are often referred to as being a measure of cruciality. Inputs with a high cruciality have a relatively strong influence on variance to the output and can thus be interpreted as identifying risks that are more significant than other sources of risk in the model.
The figure below is a tornado chart that illustrates how cruciality results can be illustrated.
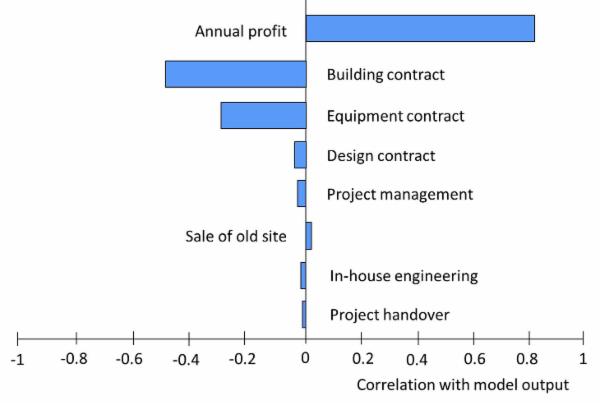
These results have been produced by running Model 5.1, which can be downloaded from this page. The model includes two inputs for benefits (annual profit and sale of old site) and a number of different inputs for cost. The cruciality results suggest that the three most significant areas of risk associated with the project are associated with profit and the costs of the building and equipment contracts.
The reason why the Tornado chart shows positive correlation for the two inputs for benefits is that higher benefit values tend to be associated with higher NPV. Conversely, higher costs tend to be associated with lower NPV. Since the prioritisation order is determined by strength of effect, it is determined by the length of each bar rather than the direction in which it is pointing.
Conditional Means
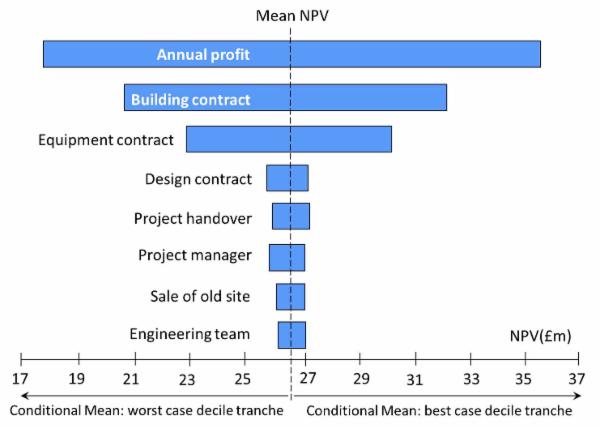
The calculation of conditional means is an alternative and more recent technique that achieves a similar purpose to the cruciality measure. It has the advantage of providing a numerical output that may be perceived to be more meaningful to managers using the results.
Conditional mean results are typically calculated using the best case and worst case decile tranches of values simulated for each risk input. Thus, if the simulation was based on 5,000 iterations, the worst case decile tranche for a cost risk input would comprise the 500 highest values that were simulated for it. In order to produce conditional mean results, a Monte Carlo simulation tool calculates the output mean that is produced by each tranche for each risk input. An example of these results is illustrated in the tornado chart below, which shows conditional means for inputs in the same model that was used to produce the cruciality chart above. By way of example, the figure shows that the worst case decile tranche for the building contract produces a mean NPV of approximately £20.5m, whereas its best case decile tranche produces a mean NPV of £32.1m.
Notes
- In practice, the cruciality and conditional means techniques produce similar results. However, there may be variation in the prioritisation order where differences between the influence of different inputs are marginal.
- If a model uses correlation to simulate the effects covariance between inputs, this may invalidate the results of the prioritisation results produced by either technique. One approach to this issue is to produce prioritisation results using a version of the model with the correlation of inputs remove. An alternative is to prioritise inputs using sensitivity analysis. However, this alternative approach can be time consuming.
- A final factor to be borne in mind is that, to some extent, all risk prioritisation techniques are affected by choices made when breaking down the structure of the model. If some elements of the model have been kept at a high level, whilst others have been broken down into more detail, the higher level elements may be ranked higher in the priority order as a consequence the relationship between variance and size.