Calculation of Discount Factors in Excel
The factor by which any future cash flow should be multiplied to obtain its present value is known as the discount factors. By definition the discount factor at time now is 1.0. Discount factors for future periods fall at an exponential rate tending to zero over time.
Although Excel includes its own NPV function, I would recommend the calculation of discount factors in a manner similar to the figures shown below. One advantage is that the modeller can view the effect of discounting directly in the spreadsheet, This can make errors easier to identify. When using the Excel function, a modeller may also fail to realise that Excel discounts all values during a year on the basis of the year-end discount factor by default. Finally, Microsoft's design and naming of the relevant formulae can be confusing.
Calculation of year-end discount factors
In practice, year-end discount factors are used in most models and are the method described in most financial textbooks. Strictly speaking, however, they are only correct if cash flows occur at anniversary points from the baseline date in the model. This may be more often true of investments than projects. For example if a bond returns a dividend on each anniversary after its purchase, this would be a correct approach.
The figure below illustrates how year end discount factors can be calculated for modelling purposes in Excel.

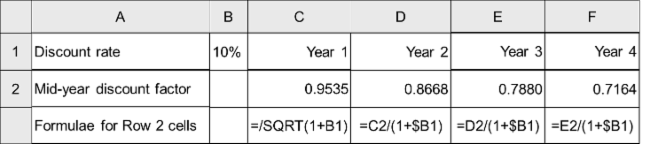
Calculation of mid-year discount factors
In the case of a project, if its cost or benefits profiles are more evenly spread, applying year-end discount factors would discount their values disproportionately. An alternative approach is to apply mid-year discount factors. This produces a more accurate result if middle of each year represents the average point in time over which costs and benefits occur.
The figure below illustrates how mid-year discount factors can be calculated for modelling purposes in Excel.